

Extrapolations
Climate data drawn as landscape — thirty-five seconds of a graph becoming a coastline.
Extrapolations opens with a main title sequence of 35 seconds.
At 35 seconds, it opens well under the 58-second median for sci-fi sequences in this catalogue.
It arrived on Apple TV+ in 2023, when Mythic Quest, Servant and Truth Be Told were also on the network.
The opening titles
Season 1
35sThe only season's sequence.
More sci-fi opening titles from the 2020s
 1 sequence
Pluribus
Vince Gilligan's first series after Breaking Bad and Better Call Saul, opened in twenty-one seconds of white dots on black that settle into the title and hold nothing else — no cast, no footage, no colour.
- Season 1
 1 sequence
Fallout
Retro-futurist advertising for a world that ended — the games' Vault-Tec aesthetic reproduced exactly, and varied per episode.
- Season 1
 2 sequences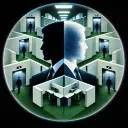
Severance
A man walking through his own head, drawn as a corporate-training diagram that keeps folding back into itself. Oliver Latta's animation, and the best argument in years that a title sequence can be the thesis.
- Season 1
- Season 2
 1 sequence
Silo
A cross-section of the silo, descending. The camera falls the length of a buried structure the characters spend the series failing to understand, which tells you the shape of the thing before the plot does.
- Season 1
 1 sequence
Foundation
Mathematics rendered as architecture — the Prime Radiant's equations building and dissolving structures across millennia.
- Season 1
 1 sequence
Alice in Borderland
An emptied Tokyo shot as architecture — Shibuya with nobody in it, which is more unsettling than anything the games do.
- Season 1